11 Evaluate
Evaluate performance of the predicted model with the test data
Model evaluation uses the set aside test data from the earlier splitting to evaluate how well the model predicts the response of presence or absence. Since the test response data is binary [0,1] and the prediction from the model is continuous [0-1], a threshold needs to be applied to assign to convert the continuous response to binary. This is often performed through a Receiver Operator Characteristic (ROC) curve (Figure 11.1), which evaluates at each threshold the confusion matrix (Table 11.1).
| Predicted | |||
| 0 (absence) | 1 (presence) | ||
| Observed | 0 (absence) | True absence | False presence |
| 1 (presence) | False absence | True presence |
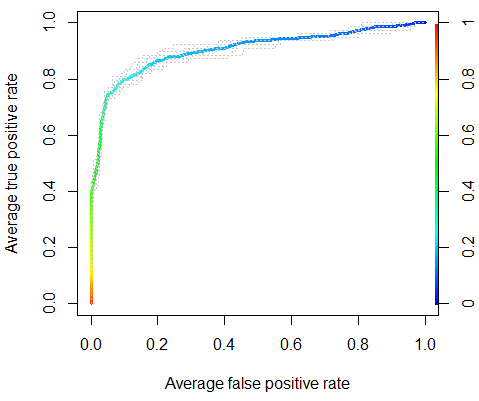
From the ROC curve, the area under the curve (AUC) is calculated, which is a measure of the model’s ability to distinguish between presence and absence. AUC values range from 0 to 1, with 0.5 being no better than random, and 1 being perfect.