R package for generating indicators from OBIS
Example Plots
Animated map of OBIS data limited to 1M randomly selected records per decade: 
All data from OBIS in one map: 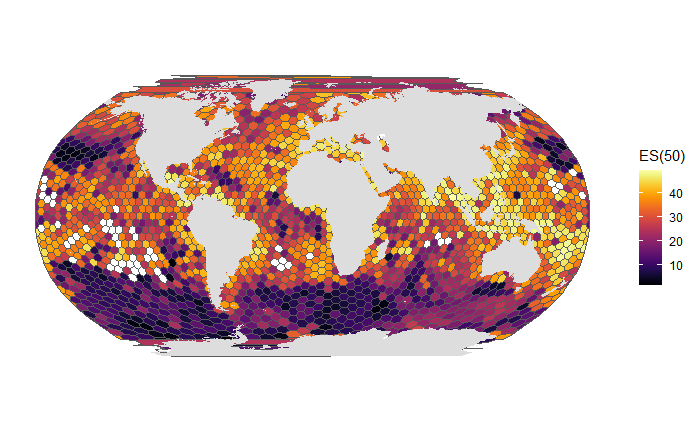
Install
Basic installation is simple:
remotes::install_github("marinebon/obisindicators")But you will also need to install dependencies. You will need to install RTools and devtools to do this. Once those are installed run the following to complete installation of this package and its dependencies:
devtools::install_local()Developer Stuff
Setup
You will likely need Rtools to install the dggridr dependency. Rtools is installed separately from R and Rstudio.
devtools::install_local()
testthat::test_local()
Awesome-obisindicators usage from the community
| project | description |
|---|---|
| global-obis-es50 | Global biodiversity assessment. |
| california-coast-ecostress-biodiversity/ | Biodiversity assessment of the CA coast as relevant to NASA EcoSTRESS data. |
| OHW22 Galapagos analysis | Biodiversity assessment in the Galapagos with and without newly collected data. |
Notes on creating vignettes
- create new vignettes via
usethis::use_vignette("new_vignette_name") - to pre-build a vignette
- set chunk’s
evalis false - then put markdown into the vignette to display the output image (or other html)
- assets go in
vignettesor inman/figures[ref)
- set chunk’s