library(dggridR)
#> Loading required package: dplyr
#>
#> Attaching package: 'dplyr'
#> The following objects are masked from 'package:stats':
#>
#> filter, lag
#> The following objects are masked from 'package:base':
#>
#> intersect, setdiff, setequal, union
#> Loading required package: rlang
#> Loading required package: sf
#> Linking to GEOS 3.8.0, GDAL 3.0.4, PROJ 6.3.1; sf_use_s2() is TRUE
#> Loading required package: sp
library(obisindicators)
library(sf)
plot_the_hex_grid <- function(occ_df){
# Create a discrete global grid
dggs <- dgconstruct(projection = "ISEA", topology = "HEXAGON", res = 5)
# assign cell numbers to the occurrence data:
occ_df$cell <- dgGEO_to_SEQNUM(
dggs, occ_df$decimalLongitude,
occ_df$decimalLatitude)[["seqnum"]]
# calc indicators
idx <- calc_indicators(occ_df)
# Add cell geometries to the indicators table:
grid <- dgcellstogrid(dggs, idx$cell) %>%
st_wrap_dateline() %>%
rename(cell = seqnum) %>%
left_join(
idx,
by = "cell")
# Plot map
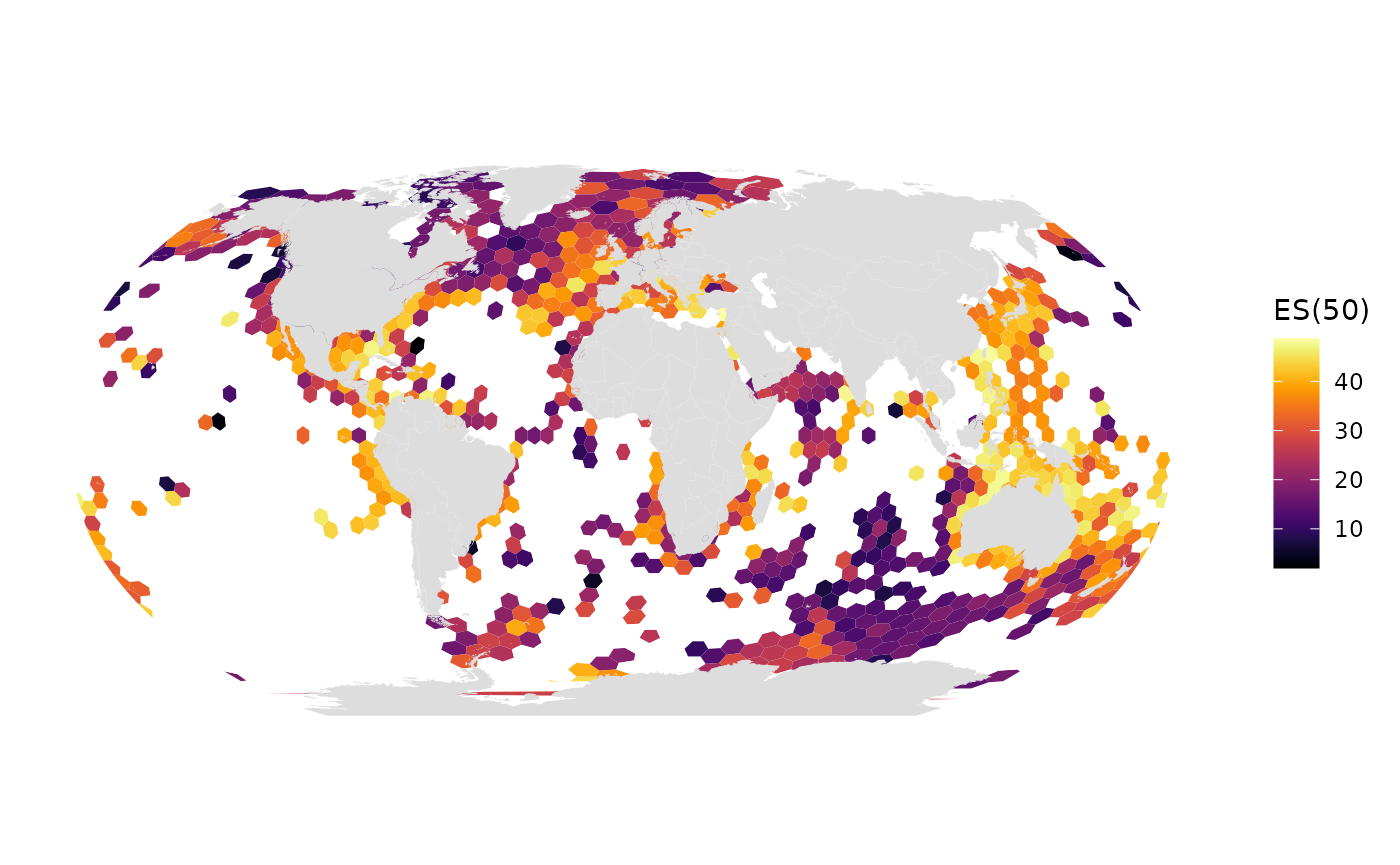
gmap_indicator(grid, "es", label = "ES(50)")
}
plot_the_hex_grid(occ_1960s)

plot_the_hex_grid(occ_1970s)

plot_the_hex_grid(occ_1980s)
plot_the_hex_grid(occ_1990s)

plot_the_hex_grid(occ_2000s)

plot_the_hex_grid(occ_2010s)
