Seascapes for Sanctuaries

App
Sanctuaries
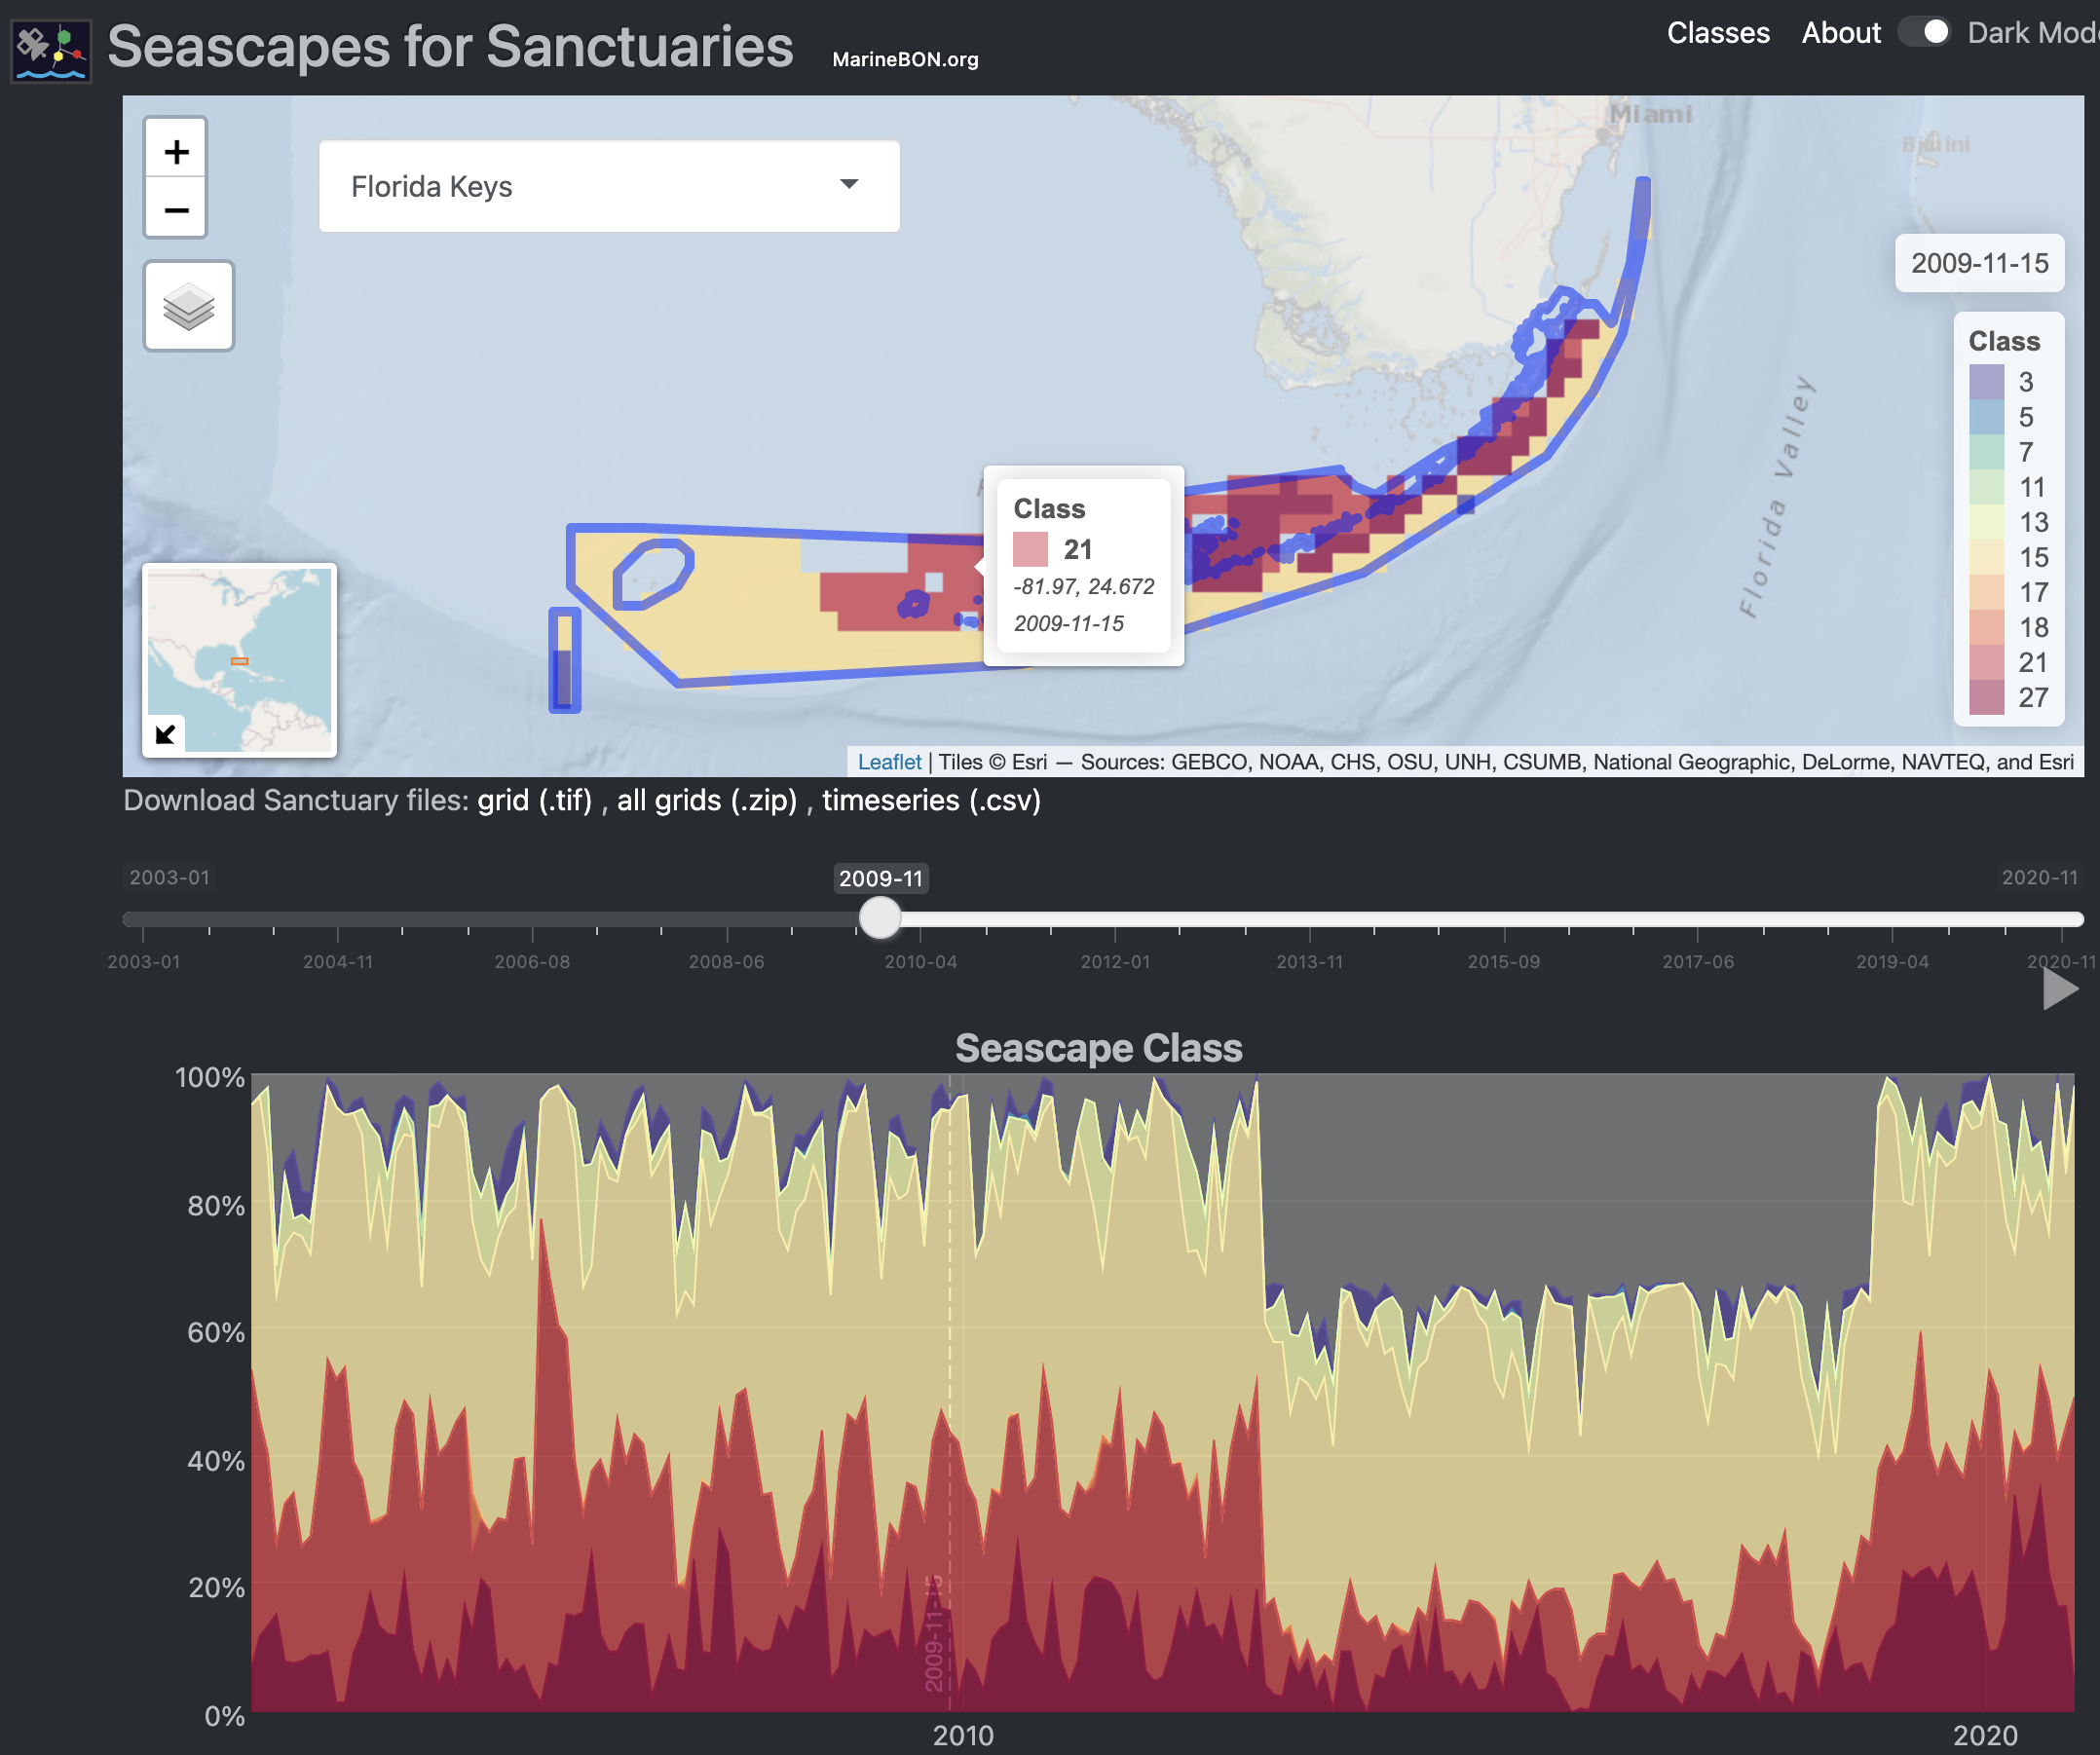
Shiny application to visualize global Seascape Classes in time and space for the National Marine Sanctuaries.
Details
Seascapes are classes of water masses defined by surface properties obtained via satellite (temperature, salinity, Chlorophyll a, CDOM, …) and an ordination statistical process (Kavanaugh et al. 2016). These may be useful proxy predictors for various species when comparing with observational data, such as environmental DNA, surveys and telemetry across MarineBON.org. The data are already served via ERDDAP, but summarizing them and visualizing them is not straightforward.
The seascapeR R package is used to read, analyze and plot the data that get used with this Seascapes Shiny app for synchronizing the map with the summarized time series by Sanctuary. You can zoom in/out of space and time, and click the play button (on right between panes) or time to update the map to that time snapshot.
References
Kavanaugh, Maria T., Matthew J. Oliver, Francisco P. Chavez, Ricardo M. Letelier, Frank E. Muller-Karger, and Scott C. Doney. 2016. “Seascapes as a New Vernacular for Pelagic Ocean Monitoring, Management and Conservation.” ICES Journal of Marine Science 73 (7): 1839–50. https://doi.org/10.1093/icesjms/fsw086.